
Visual Linear Algebra Online, Section 1.4

 (red) is the butterfly curve and
 ") (blue) is its image under a linear transformation that reflects across the line
(blue) is its image under a linear transformation that reflects across the line  .
. We have already alluded to the idea of linear transformations in two dimensions at various points in the first three sections. One example we encountered, in Section 1.1, “Points, Coordinates, and Graphs in Two Dimensions”, consisted of a system of linear equations that transformed rectangular coordinates to slanted coordinates.
Other examples of a linear transformations in two dimensions arose in the exercises of that section. There, for example, a system of linear equations transformed rectangular coordinates to rotated coordinates.
We also saw rotations arise as ways to visualize the process of elimination in Section 1.3, “Systems of Linear Equations in Two Dimensions”. However, because the rotations considered in that section are not about the origin, it turns out that those transformations are not linear. The reasons for that will be explored in this section.
Linear Functions and Linear Transformations
Linear Functions in Calculus
In calculus and its prerequisite subjects, a linear function 
=mx+b")


Linear Transformations as Mappings and Vector Fields
This definition of a linear function is simple, but in linear algebra we choose to define a linear function differently. We also tend to give it a different name — a linear transformation.
The words “transformation” and “function” are basically synonyms in mathematics. However, the word “transformation” has a connotation to its meaning that is a bit more geometric/visual.
We are especially interested in visualizing linear transformations in two ways, described below. These descriptions introduce a bit more terminology that we will explore in the examples to follow.
- Linear transformations are linear mappings (or linear maps, for short), which take a given set of points and “send” or “map” these points to another set of points.
- Linear transformations are linear vector fields which take a given set of points and “attach” vectors to them.
We now commence with our exploration through examples.
Examples of Linear Transformations
Within each example of this section, we start by describing transformations geometrically. We also consider what makes each transformation linear or not. Most of these are examples of linear transformations in two dimensions.
We will find it helpful to use a special symbol for the two-dimensional rectangular (Cartesian) coordinate plane. The symbol we use is standard. It is 
We also use the standard notation 

Example 1: Reflection about the horizontal axis
Define a transformation 
")
In other words, if the input of 
")
=(x,-y)")
)=(x,-y)")
\mapsto (x,-y)")
\xrightarrow{T} (x,-y)")
If we let 

=T(x,y)")

Visualizing the Mapping
This transformation can be visualized as shown below.
 which maps a point to its reflection across the horizontal axis . The mapping has this geometric effect for all points in the plane. This also means that points that start out below the horizontal axis get mapped to points above the horizontal axis. Points exactly on the horizontal axis get mapped to themselves.
Alternatively, via the natural association between points and vectors discussed in Section 1.2 “Vectors in Two Dimensions”, we can view this as a transformation of vectors. This can be written =\left(\begin{array}{c} x \\ -y \end{array}\right)")
\mapsto \left(\begin{array}{c} x \\ -y \end{array}\right)")

The Image of a Set of Points
Suppose we are given a set of points 
This set of outputs is called the image of =\{T(x,y)\, |\, (x,y)\in A\}")
")

For example, suppose \, |\, -10\leq x-4y\leq 0\mbox{ and } 0\leq 3x-2y\leq 10\}")


An animation showing 
 of a parallelogram under a reflection across the horizontal axis is another parallelogram.
While it is useful and relatively simple to consider images of parallelograms, we need not be constrained by them. We can consider the image of a more complicated set, such as the “butterfly curve”. Once again,
 (red) is the ‘butterfly curve’. Its image is the blue butterfly curve that is upside-down.
From these examples, you can start to get an inkling of how linear algebra is useful for computer graphics!
What Makes the Reflection Linear?
But why is this reflection a linear transformation? For one thing, in its formula, the output contains the input variables only to the first power:
A more important (related) reason is this: =sT({\bf u})+tT({\bf v})")


To see why this is true, let ")
")
")
Then
=T\left(\begin{array}{c} sx_{1}+tx_{2} \\ sy_{1}+ty_{2}\end{array}\right)=\left(\begin{array}{c} sx_{1}+tx_{2} \\ -(sy_{1}+ty_{2})\end{array}\right)=\left(\begin{array}{c} sx_{1}+tx_{2} \\ -sy_{1}-ty_{2}\end{array}\right)")
On the other hand,
+tT({\bf v})=sT\left(\begin{array}{c} x_{1} \\ y_{1} \end{array}\right)+tT\left(\begin{array}{c} x_{2} \\ y_{2} \end{array}\right)")
+t\left(\begin{array}{c} x_{2} \\ -y_{2} \end{array}\right)=\left(\begin{array}{c} sx_{1}+tx_{2} \\ -sy_{1}-ty_{2}\end{array}\right)")
Hence,
What Makes This Work?
It is, in part, the first powers of
You should take the time to check that there are vectors 

\not=sT({\bf u})+tT({\bf v})")
.
.
Now you might ask: why not allow linear transformations to include situations where constants are being added? The short answer is this. Defining a linear transformation purely by the property
Example 2: Reflection about the line y = x
Define a transformation 
If you think carefully, you will see that the formula for =(y,x)")
\mapsto (y,x)")
\xrightarrow{T} (y,x)")
=\left(\begin{array}{c} y \\ x \end{array}\right)")
As a system of linear equations,

The figure below shows how the transformation acts on both the point ")
Also, make sure you don’t get confused by the notation. For the image point ")
 which maps a point to its reflection across the line . In this picture, we see that
 =(5,-2)") .
.The Images of Sets of Points
We now consider the images of the parallelogram and the butterfly curve defined in Example 1.
Here is the relevant animation for the parallelogram
 of a parallelogram under a reflection across the line is another parallelogram.
And here is the relevant animation for the butterfly curve.
(red) is the ‘butterfly curve’. Its image is the blue butterfly curve that is sideways.What Makes the Reflection Linear?
Once again, the key fact that makes this reflection linear is that
We take the time to note that this condition is equivalent to the following two facts being true.
for any vectors
for any vector
and any scalar

We also remark that mathematical induction can be used to prove that, for an arbitrary collection of 
=s_{1}T({\bf u}_{1})+s_{2}T({\bf u}_{2})+\cdots+s_{n}T({\bf u}_{n})")
Using Sigma (summation) notation, this property can be written like this:
=\displaystyle\sum_{i=1}^{n}s_{i}T({\bf u}_{i})")
Once you know a given transformation is linear, you may use these equations any time you need it. These facts are all related and do have a name. Any of them can be called an operation-preserving property of a linear transformation.
Example 3: Expansion (Dilation) Away From the Origin
Define a transformation
This means the formula for =(2x,2y)")
=\left(\begin{array}{c} 2x \\ 2y \end{array}\right)")
As a system of linear equations,

The figure below shows the action of this transformation on a generic point/vector.
 which maps a point/vector to the point/vector
 ") which is twice as far from the origin along the same ray from the origin.
which is twice as far from the origin along the same ray from the origin.The Images of Sets of Points
We again consider the images of the parallelogram and the butterfly curve defined in Example 1. First, an animation of for the parallelogram.
 of a parallelogram under an expansion away from the origin by a factor of two.
And here is the animation for the butterfly curve.
 (red) is the ‘butterfly curve’. Its image is the blue butterfly curve that is twice as big.
Take the time to check linearity. Check that
Example 4: Rotation About the Origin
Define a transformation 
The formula for this turns out to be =(-y,x)")
=\left(\begin{array}{c} -y \\ x \end{array}\right)")
As a system of linear equations,

This is best shown with a picture.
 which maps a point/vector to the point/vector
 ") . This is a counterclockwise rotation of about the origin. In this picture, we see that
. This is a counterclockwise rotation of about the origin. In this picture, we see that =(-2,5)") .
.The Images of Sets of Points
Here is an animation of the image of our parallelogram.
 of a parallelogram under a rotation of 90 degrees counterclockwise about the origin.
And here is an animation for the butterfly curve.
 (red) is the ‘butterfly curve’. Its image is the blue butterfly curve that is rotated counterclockwise by 90 degrees about the origin.
You should once again take the time to check linearity.
Example 5: Shear Transformation
Another kind of transformation that is linear is a “shear transformation”. One basic example of this type maps the horizontal vector ")
")
")
It is important to imagine the geometric effect of this transformation on the vertical vector as “pushing” (“shearing”) the vector to the right so that it stays the same height but gets more and more slanted. It is also important to realize that similar behavior is going on below the horizontal axis, but in the leftward direction. This means the downward-pointing vertical vector ")
")
The resulting formula for this turns out to be =(x+y,y)")
=\left(\begin{array}{c} x+y \\ y \end{array}\right)")
As a system of linear equations,

Checking the linearity (operation-preserving) condition is a tiny bit more work in this case. Take the time to do so before looking at the visuals below.
. An arbitrary point/vector gets mapped to ") . This results in a rightward “pushing” when the point/vector is above the horizontal axis and a leftward “pushing” when it is below.
. This results in a rightward “pushing” when the point/vector is above the horizontal axis and a leftward “pushing” when it is below.The Images of Sets of Points
The “pushing effect” is easier to see when we look at our old friends, the parallelogram and the butterfly curve.
of a parallelogram under a horizontal shear transformation. There is a rightward ‘pushing effect’ here because the parallelogram is above the horizontal axis. (red) is the ‘butterfly curve’. Its image is the blue butterfly curve that is a horizontal shear of the original curve. The ‘pushing effect’ is rightward above the horizontal axis and leftward below it.Example 6: Translation (a Nonlinear Transformation!)
A geometric translation (shift) is certainly a simple transformation. For example, we could take all the points in the plane and shift them to the right by 3 units and upward by 2 units.
As a mapping =(x+3,y+2)")
=\left(\begin{array}{c} x+3 \\ y+2 \end{array}\right)")
This certainly looks both simple and linear. However, according to our “new” definition of linearity, it is nonlinear. To see this, we only need to find one example of scalars
Probably any example you pick will be sufficient. For example, suppose 
")
")
=T\left(\begin{array}{c} 6 \\ 8\end{array}\right)=\left(\begin{array}{c} 9 \\ 10\end{array}\right)")
On the other hand,
+tT({\bf v})=T\left(\begin{array}{c} 4 \\ 3\end{array}\right)+T\left(\begin{array}{c} 2 \\ 5\end{array}\right)=\left(\begin{array}{c} 7 \\ 5\end{array}\right)+\left(\begin{array}{c} 5 \\ 7\end{array}\right)=\left(\begin{array}{c} 12 \\ 12\end{array}\right)")
We can still think about images of sets of points with such a transformation. In fact, for translations, this is relatively easy. But still, the larger point holds: this transformation is actually nonlinear.
Example 7: Rotation About a Point that is Not the Origin (a Nonlinear Transformation!)
A rotation of points about a given point that is not the origin is likewise a simple transformation that is nonlinear.
To find a formula for such a transformation, it is best to think in stages. For example, suppose we want to rotate points by ")
We could start by using a translation that maps \mapsto (x-3,y-2)")
Next, we could rotate the resulting points about the origin (see Example 4). This mapping is \mapsto (-y,x)")
Finally, translate the result back to be centered on the original point by using the mapping \mapsto (x+3,y+2)")
The composition of these three functions is the mapping we seek. In stages, it would be
\mapsto (x-3,y-2)\mapsto (-(y-2),x-3)=(2-y,x-3)")
=(-y+5,x-1)")
The 

=(-y+5,x-1)")
Example 8: Polar Coordinates (a “Strongly” Nonlinear Transformation)
Recall our brief discussion of polar coordinates at the end of Section 1.1, “Points, Coordinates, and Graphs in Two Dimensions”. The “conversion equations” from polar coordinates ")
 \\ y & = & r\sin(\theta). \end{array}\end{cases}")
This defines a transformation =T\left(\begin{array}{c} r \\ \theta \end{array}\right)=\left(\begin{array}{c} r\cos(\theta) \\ r\sin(\theta) \end{array}\right)")
It is important to realize in the last paragraph that the 

It is interesting to watch the butterfly curve being transformed under this mapping. Keep in mind that it is most definitely a (strongly) nonlinear mapping, which makes its behavior more difficult to understand. Take note of how the butterfly is essentially being wrapped around the origin in a strange way. In fact, the larger the initial second
Also note how the axes get relabeled during the animation.

Example 9: Projection Onto the Horizontal Axis
For our final example of a transformation, we return to one that is linear. Its behavior, however, is somewhat “degenerate” in certain ways.
Define a transformation =\left(\begin{array}{c} x \\ 0 \end{array}\right)")
Here is a picture of the effect of this linear transformation, called a “projection”, on an arbitrary point/vector. It is called this because the image point/vector is like a “shadow” of the original points/vector. In the present example, the “light source” that causes this shadow to be cast has “light rays” that come straight down/up perpendicular to the horizontal axis.
 onto the horizontal axis. An arbitrary point/vector gets mapped to
 ") .
. The Images of Sets of Points
Here is an animation showing the geometric effect of this projection mapping on our parallelogram and the butterfly curve. Notice that both sets get “squashed” onto the
 -axis.
Observations about the Examples
Some summary observations about these examples are in order.
- Some linear transformations are “rigid” (isometries): they preserve distances and areas. Examples of this include rotations about the origin and reflections across lines through the origin fall in this category.
- There are some nonlinear transformations that are also rigid. Translations, rotations about non-origin points, and reflections about lines that do not go through the origin fall in this category (we did not consider an example of the last type).
- Some linear transformations are not rigid. Expansions (dilations) and projections do not preserve distances or areas. Shears do not preserve distances.
- For “most” linear transformations from the plane to itself, the origin is the only point that gets mapped to the origin. This is true for all of our linear transformation examples except for the projection mapping. This is equivalent to “most” linear transformations
- For “most” linear transformations from the plane to itself, every point is the image of some other point. This is true for all of our linear transformation examples except for the projection mapping. This is equivalent to “most” linear transformations
The Examples Reimagined as Vector Fields
As mentioned earlier, there is another way that transformations like these can be visualized: as vector fields. Given a transformation
This perspective is of utmost importance in applying linear algebra to the study of differential equations. More on this topic to come in later sections of this text.
Examples 1 and 2
The formula for such a transformation as a vector field can be written in a suggestive form, with the input as a point and the output as a (column) vector. For Examples 1 and 2 above, the forms would be =\left(\begin{array}{c} x \\ -y \end{array}\right)")
=\left(\begin{array}{c} y \\ x \end{array}\right)")
The vector field-graphs for these two examples are shown below. For formatting reasons, we are not able to label these plots with outputs as column vectors. The big dot at the origin for each graph represents the fact that =\left(\begin{array}{c} 0 \\ 0 \end{array}\right)")
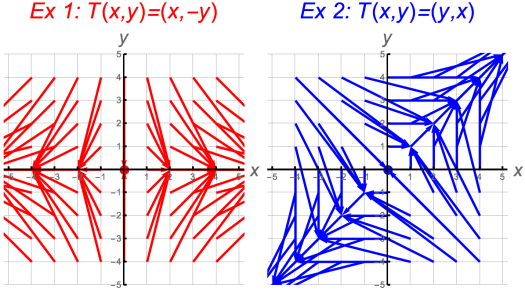 , such as
 =(2,1)") , the output is an arrow/vector based at that point. In the vector field on the left, this output is
, the output is an arrow/vector based at that point. In the vector field on the left, this output is ") . In the vector field on the right, this output is
. In the vector field on the right, this output is ") .
. Examples 3 and 4
For Examples 3 and 4, the formulas are =\left(\begin{array}{c} 2x \\ 2y \end{array}\right)")
=\left(\begin{array}{c} -y \\ x \end{array}\right)")
The plots for Examples 3 and 4 are shown below. The expansion one (example 3) is a bit tough to see because the arrows lie on top of each other and get so long. Once again, the big dot at the origin represents the fact that
 , such as , the output is an arrow/vector based at that point. In the vector field on the left, this output is
 ") . In the vector field on the right, this output is
. In the vector field on the right, this output is ") .
. Examples 5 and 6
For Examples 5 and 6, the formulas are =\left(\begin{array}{c} x+y \\ y \end{array}\right)")
=\left(\begin{array}{c} x+3 \\ y+2 \end{array}\right)")
The plots for Examples 5 and 6 are shown below. Note that the “big dot” for the second one is not at the origin. This is related to the fact that example 6 is a nonlinear transformation.
 , such as , the output is an arrow/vector based at that point. In the vector field on the left, this output is
 ") . In the vector field on the right, this output is
. In the vector field on the right, this output is ") .
. Finally, we look at the vector field for Example 9. Note that all the vectors that are not on the
 , such as , the output is an arrow/vector based at that point. This output is
 ") .
. Relationship to the Original Geometrically-Described Mapping
It may not be clear, besides having the same formula, how these vector field pictures are related to the pictures for the original mappings. This can be made clearer with yet one more animation.
Consider Example 2, the reflection across the line
To see how this is related to the vector field, we make an animation that transforms the “identity” vector field =\left(\begin{array}{c} x \\ y \end{array}\right)")
 (blue) can be obtained from the
 ‘identity’ vector field
as reflections across many lines.Relationship to Solutions of Differential Equations
In the study of differential equations, we seek solution curves which “follow” vector fields. When many of these solution curves are graphed, we get a picture of the “flow” of the vector field. The flow of the linear vector field
 . Compare this picture with the blue vector field from the animation directly above. Note how the curves in this flow ‘follow’ the vectors in the vector field.
We end this section by viewing two animations showing how the vector fields for the rotation =\left(\begin{array}{c} x \\ y \end{array}\right)")
Exercises
- Let
for some constants
and (b)
for all
if and only if
.
- Determine a formula for a transformation
- Determine a formula for a transformation
rotation about the origin. Next, prove that
- Let
, and
be constants. Prove that the transformation
is linear.
- Give a proof that the translation transformation
is nonlinear.
- Prove that the transformation
Challenge Exercises
- (Challenge) The parallelogram
and
in the following way:
. Use the linearity of the transformation
.
- (Challenge) Use a picture to help you explain why the transformation
represents a counterclockwise rotation by an angle of
Video for Section 1.4
Here is a video overview of the content of this section.